


Edition 03 · July 22, 2026 · covering July 8 to July 21 · ~9 min read · Subscriber edition
How to read this. Heat (1 to 5) shows how active a domain is this period, not its long-run importance. Arrows show direction versus the last edition. Every material claim links to a primary release or two independent, reputable sources; where the model is projecting rather than reporting, we say so directly.
The national read
Minus 0.4%. Consumer prices actually fell in June, the largest one-month decline since April 2020, and the annual inflation rate dropped to 3.5% from May’s 4.2% (Bureau of Labor Statistics, July 14, 2026). In any other month, that would be the story. This month it is the footnote.
Between the report’s June data window and its July 14 release, the ceasefire with Iran collapsed. The United States resumed strikes on July 7 and has kept striking since; Iran hit more tankers in the Strait of Hormuz; Yemen’s Houthi militants threatened to blockade Saudi shipping (CNBC, July 21, 2026). Brent crude went from under $70 a barrel to above $90 (Bloomberg, July 20, 2026). The national average gasoline price climbed ten cents in a single week, to $3.94 a gallon (AAA, July 16, 2026).
So the bond market saw the best inflation report in six years and priced in a rate increase. Futures still lean roughly four to one toward the Federal Reserve holding rates at its July 28 to 29 meeting, but they now put better than even odds on an increase by September (CNBC, July 14, 2026). That’s the thread connecting all of this: official statistics take weeks to collect and publish, so the ‘freshest’ data is really a snapshot of last month’s economy, one that may no longer exist by the time the report lands. Next week the Fed has to set policy with that rearview mirror: believe June’s cooling on paper, or July’s reheating at the pump.
Deep dive: The Federal Reserve. The best inflation report in six years may not survive the month
A backward-looking gift with a short shelf life
June consumer prices fell 0.4% on the month, with the annual rate down to 3.5% and core prices, which leave out food and energy, flat on the month and up 2.6% on the year; producer prices fell 0.3% the next day, their first decline since August 2025 (Bureau of Labor Statistics, CPI, July 14, 2026; PPI, July 15, 2026).
Nearly all of that improvement is one channel running in reverse: energy. The energy index fell 5.7% in June, when Brent crude sat under $70; wholesale diesel fell 18% and wholesale gasoline 12% in the same month (Bureau of Labor Statistics, July 15, 2026). Energy prices pass into the headline inflation number within one to two months in the model’s energy-to-inflation channel. Oil is now more than $20 a barrel higher than the price that produced June’s decline, so the July report, due August 12, is positioned to give much of it back.
Borrowers briefly benefit from the good print; holders of bonds already lost, because yields rose on the oil news, with the 10-year Treasury yield finishing July 17 at 4.55% and climbing toward 4.6% (Advisor Perspectives, July 17, 2026; CNBC, July 14, 2026). Anyone shopping for a mortgage inherits that move within weeks.
The less obvious point sits in the minutes of the June 16 to 17 meeting, released July 8: nine of the eighteen officials who submitted projections penciled in at least one rate increase this year, and that split formed before the oil spike (Federal Reserve, July 8, 2026). Chair Kevin Warsh gives no forward guidance, so markets are trading the committee’s projections, not the chair’s words. Half the committee already wanted to raise rates. Now an energy shock is pushing up the headline inflation number, the one households actually see, while core inflation, which the shock doesn’t touch, sits at 2.6%. Raising rates won’t fix an oil supply problem. But half the committee may vote to do it anyway.
Base case: a hold on July 29 with harder language about energy, roughly the four-in-five odds markets assign (J.P. Morgan Wealth Management, July 2026). The scenario, perhaps one in five: an increase, if Brent holds above $90 into the meeting. What would confirm this reading: a statement that dismisses the energy spike and points to the 2.6% core. What would break it: a hike before the July inflation report. That would tell us this committee reacts to gas prices, not the underlying trend.
Deep dive: Energy and trade. The dual blockade turns a price shock into a supply-chain shock
Two chokepoints at sea, one tariff switch on land
The war escalated from tanker incidents to a standing campaign this period: continuous American strikes on Iran since July 7, a renewed United States naval blockade of Iranian ports, fresh Iranian hits on tankers on July 13 and July 21, and a Houthi threat to blockade Saudi shipping, with regional mediators now circulating a 10-day ceasefire proposal (CNN, July 13, 2026; CNBC, July 21, 2026).
The first channel is the familiar one, and the fastest in the model: crude to pump to household budgets, in weeks. Brent settled at $88.10 on July 17 and topped $90 on July 20, its highest since June 10 (CNBC, July 17, 2026; Bloomberg, July 20, 2026). The second channel is slower and less watched: diesel. Wholesale diesel fell 18% in June and is the fuel that moves freight; its reversal reprices the shipping cost of nearly every good with a lag of one to two quarters.
Energy producers and shippers collecting war-risk premiums gain. Airlines, truckers, and chemical makers running on thin fuel margins lose first. Households lose regressively, because fuel takes a larger share of a smaller budget.
The less obvious point is the calendar collision. On July 24, three days before the Federal Reserve meets, the 10% blanket tariff surcharge on imports expires by operation of law at the end of its 150-day statutory clock, and the Office of the U.S. Trade Representative’s proposed replacement, 12.5% duties on goods from 46 countries, is positioned to take its place; no official effective date has been announced (Nakachi Eckhardt & Jacobson, July 4, 2026; Tech Times, July 20, 2026). Importers therefore face rising ocean freight and war-risk costs and a new tariff schedule in the same seven days, a double reset of import costs that lands in fall goods prices just as the Federal Reserve hopes energy pass-through will fade.
Base case: intermittent strikes continue and Brent holds in the upper $80s to low $90s, with analysts expecting upper-$70s prices by fall if the mediators’ proposal takes hold. Upside risk, perhaps one in four: a Houthi blockade of Saudi traffic materializes and Brent moves well above $100, adding a percentage point or more to headline inflation, the path the June edition traced. What would confirm de-escalation: acceptance of the 10-day ceasefire and falling war-risk insurance rates. What would break it: a strike on Saudi or Emirati export infrastructure, which would widen the shock beyond Iranian barrels.
Deep dive: Households. A sentiment recovery built on a gasoline price that no longer exists
The mood improved on data from a different month
Consumer sentiment jumped almost 10% in early July to 54.4, its highest since February, with one-year inflation expectations easing to 4.2% from 4.6% (University of Michigan Surveys of Consumers, preliminary, July 17, 2026).
The survey itself explains the gain: cheaper gasoline. And most responses were collected before the July 7 resumption of strikes and the gas-price turn that followed (Advisor Perspectives, July 17, 2026). The model’s energy-to-household channel is its fastest sentiment mover, and it is now running in reverse: the pump price that built this recovery over six weeks has been rising ten cents a week since then. Spending seems to be holding rather than growing. June retail sales rose 0.2%, and the Census Bureau notes the change is not statistically distinguishable from zero; excluding autos and gasoline, sales rose 0.4% (Census Bureau, July 16, 2026).
Who is exposed: the sentiment gain was strongest among consumers without a college degree, the same group for whom gasoline takes the biggest budget share, so the reversal would land hardest exactly where the improvement was largest. Credit is not cracking: the biggest card lender’s loss rate is holding near guidance, and bank chiefs called the economy resilient in July 14 earnings (JPMorgan Chase, July 14, 2026; CNBC, July 14, 2026).
The less obvious point: both props under consumer spending weakened in the same ten days. Cheap gasoline is gone, and the stock-market wealth effect is thinning too, with the S&P 500 posting its first losing weeks since March as the AI-linked names that carried the rally sell off (Associated Press, July 17, 2026; CNBC, July 20, 2026). The model treats the consumer as an amplifier, not a bystander: if both supports give way together, the effect widens into services and goods demand and returns to the Federal Reserve’s table in the fall as a growth problem layered on an inflation problem.
Base case: The final reading shows consumer sentiment giving back some of its July jump — but spending should hold up, because the job market is still solid: claims fell to 208,000 in mid-July and layoffs remain low. (Reuters via U.S. News, July 16, 2026). The scenario, perhaps one in three: gasoline crosses and holds above $4 through August, sentiment retests May’s record low, and third-quarter spending stalls. Confirm or break: the final July sentiment reading on July 31, and whether the weekly claims series stays near 210,000.
Chain of the period
One chain, traced start to finish through the transmission map.
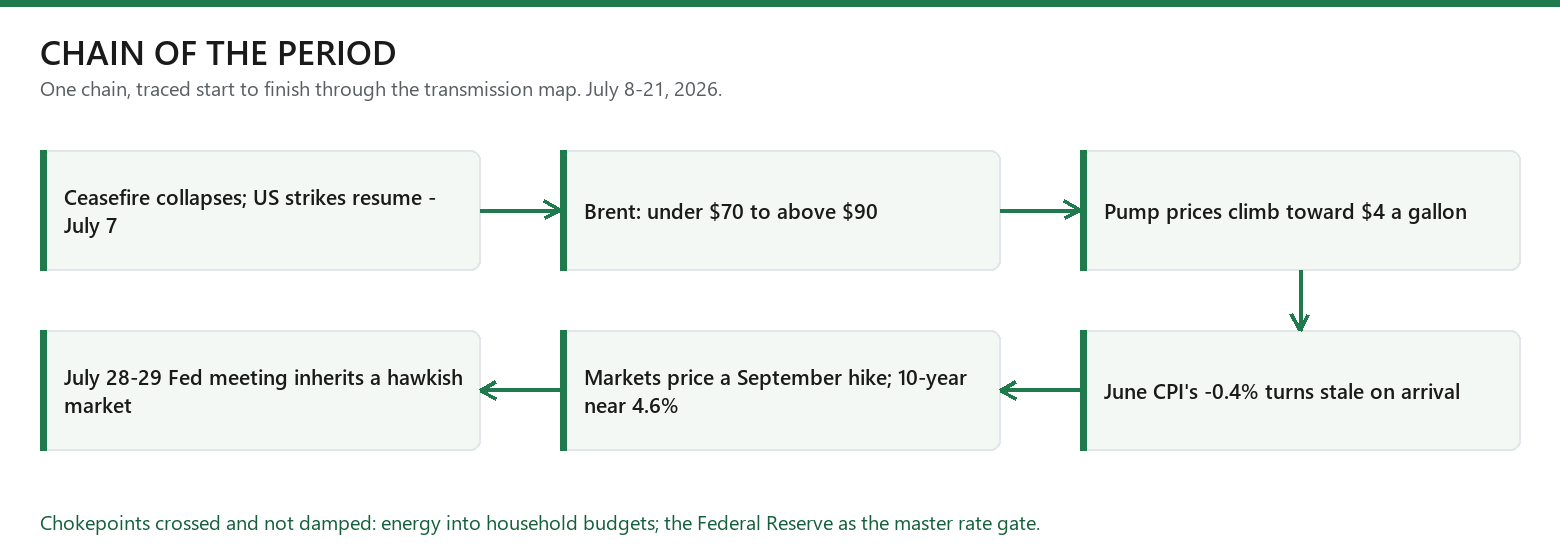
Start with the ceasefire’s collapse on July 7. Oil travels the war news first: Brent moves from under $70 to above $90 in two weeks, and the pump follows at ten cents a week. That runs the model’s energy-to-household channel, one of the two paths it never softens, straight into budgets and sentiment. It also rewrites the meaning of the period’s biggest data release: June’s 0.4% price decline, the best in six years, was manufactured by exactly the cheap oil that no longer exists, so markets skipped celebrating it and moved rate-increase odds up instead, pushing the 10-year Treasury yield toward 4.6%. The chain ends at the second unsoftened point, the Federal Reserve itself: a committee already split nine-to-nine on raising rates this year walks into its July 28 to 29 meeting with a hawkish market it never guided. The cross-current to hold onto: the AI selloff is thinning the wealth effect at the same moment, so the hawkish case and the household squeeze are building together.
Sector & region movers
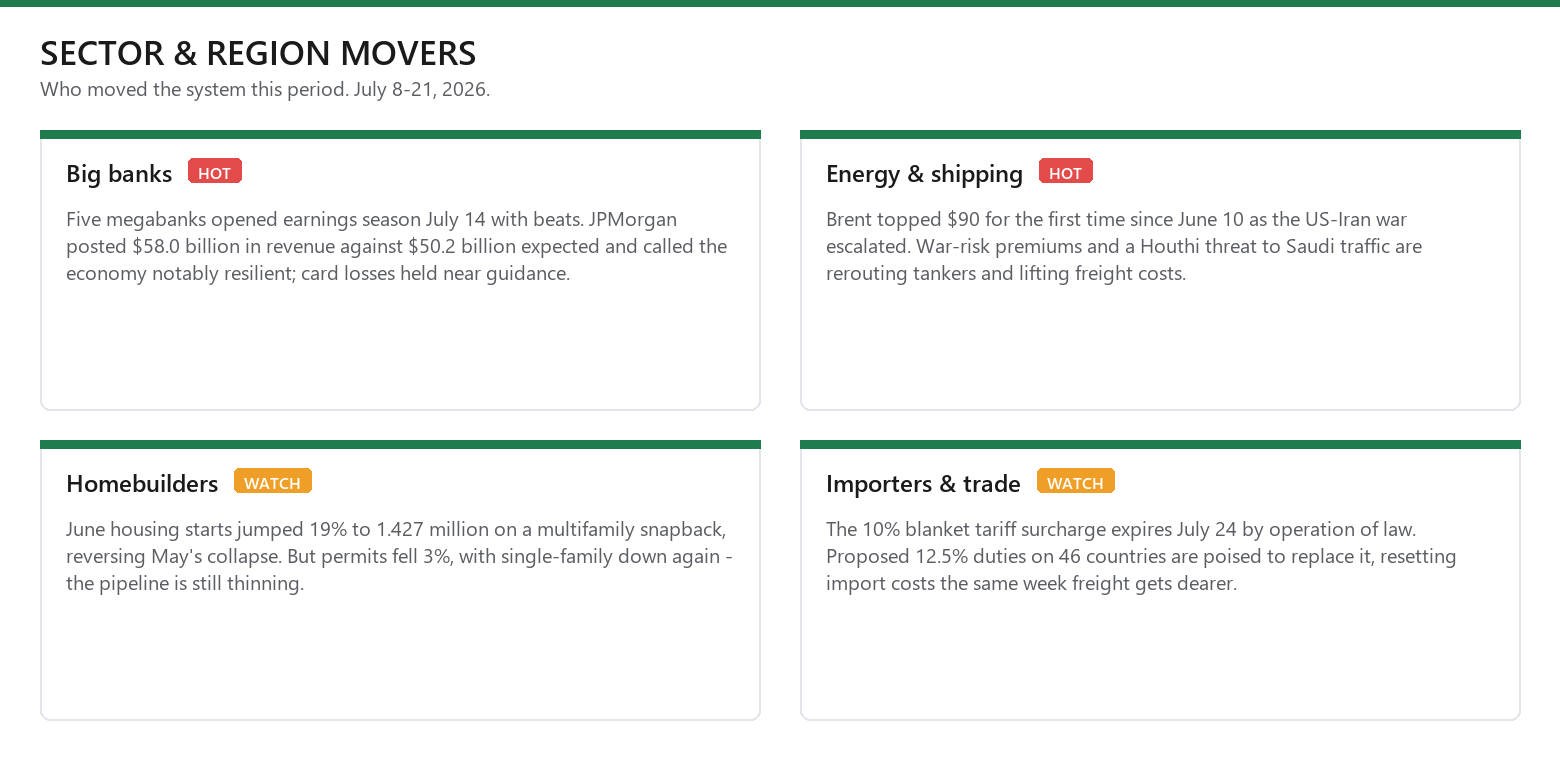
What to watch next
The tariff switch, July 24: the 10% surcharge expires by operation of law; whether the proposed 12.5% duties on 46 countries take effect alongside it, and at what scope.
June existing-home sales (National Association of Realtors, July 23): whether resale supply keeps improving while the new-construction pipeline thins.
The Federal Reserve’s meeting, July 28 to 29, and Chair Kevin Warsh’s press conference: the statement’s energy language is the tell, given nine officials already penciled in a hike this year.
Second-quarter gross domestic product, advance estimate (Bureau of Economic Analysis, late July): the first full-quarter read on whether spending momentum held through the spring.
June personal income and outlays, with the Federal Reserve’s preferred price measure (Bureau of Economic Analysis, July 31), and the final July consumer-sentiment reading the same week: whether 54.4 survives the gas-price turn.
Big-technology earnings, late July: capital-spending guidance from the largest cloud and AI infrastructure companies remains this model’s clearest break signal for the market and wealth channel.
The heat map: all fifteen domains
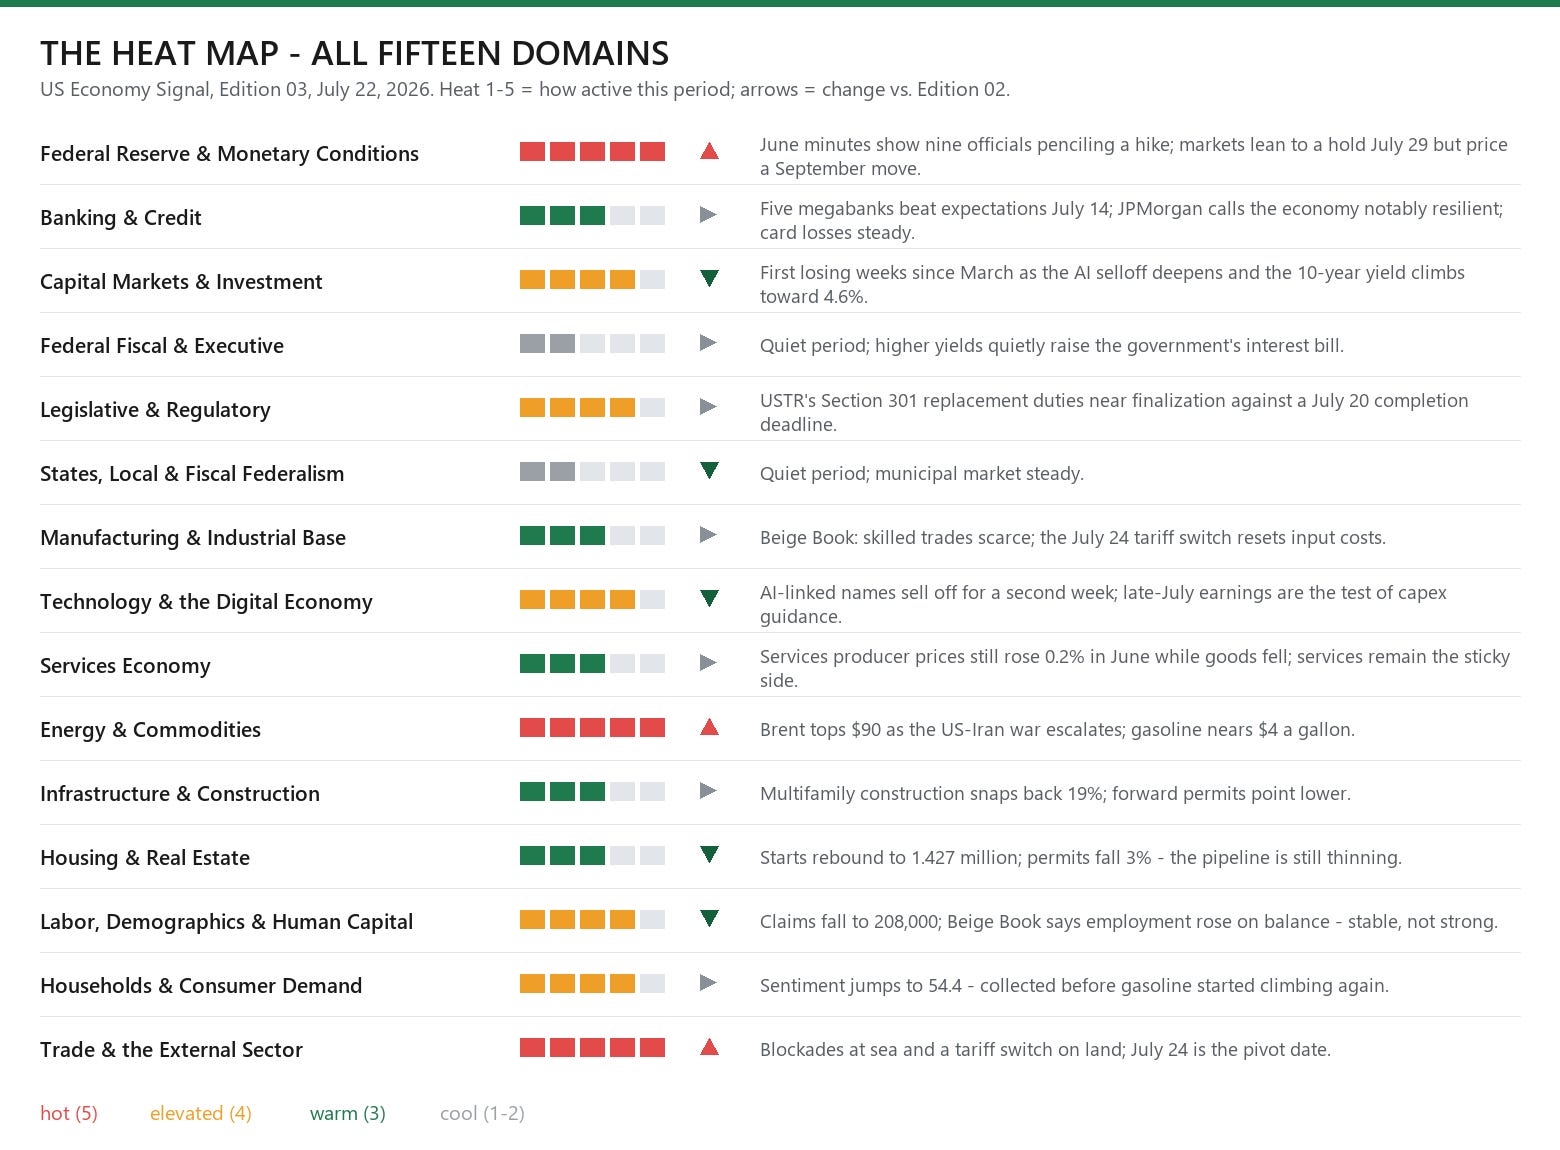
Overlay pressure this period.
Politics and elections: elevated. The tariff transition is running on executive authority and statutory clocks, not legislation, and Congress has no extension bill pending.
Global economy and geopolitics: hot. The United States and Iran are in open, continuing hostilities, with a dual blockade around the Strait of Hormuz and a possible new front at Saudi shipping lanes; mediators are circulating a 10-day ceasefire proposal.
Inflation regime: two-sided. June’s prints were the softest in years, core sits at 2.6%, and household inflation expectations eased to 4.2%, but all three readings predate the oil spike now working toward the August data.
Technology and AI disruption: high. The AI trade is being tested in markets for the first time in months even as the capital spending behind it continues. Climate, disasters and insurance: low to moderate. The Atlantic season has stayed quiet so far this period.
Sources
Every material claim in this edition is verified to one primary (Tier-1) source or two independent, reputable (Tier-2) sources. Items resting on a single secondary source are flagged in-text or in the citation above.
***