

Edition 02 ·July 8, 2026 · covering June 22 to July 7 · ~9 min read · Subscriber edition

A note on what’s changing. Starting with this edition, the deep dives spend less space repeating the news and more on what it means. You already follow these developments, so we go to the next step: what each event sets in motion, who it helps or puts at risk, and what to watch to see whether the reading holds. We still show every fact and link every source. And we keep writing in plain language, with terms spelled out. Tell us what lands and what doesn’t.
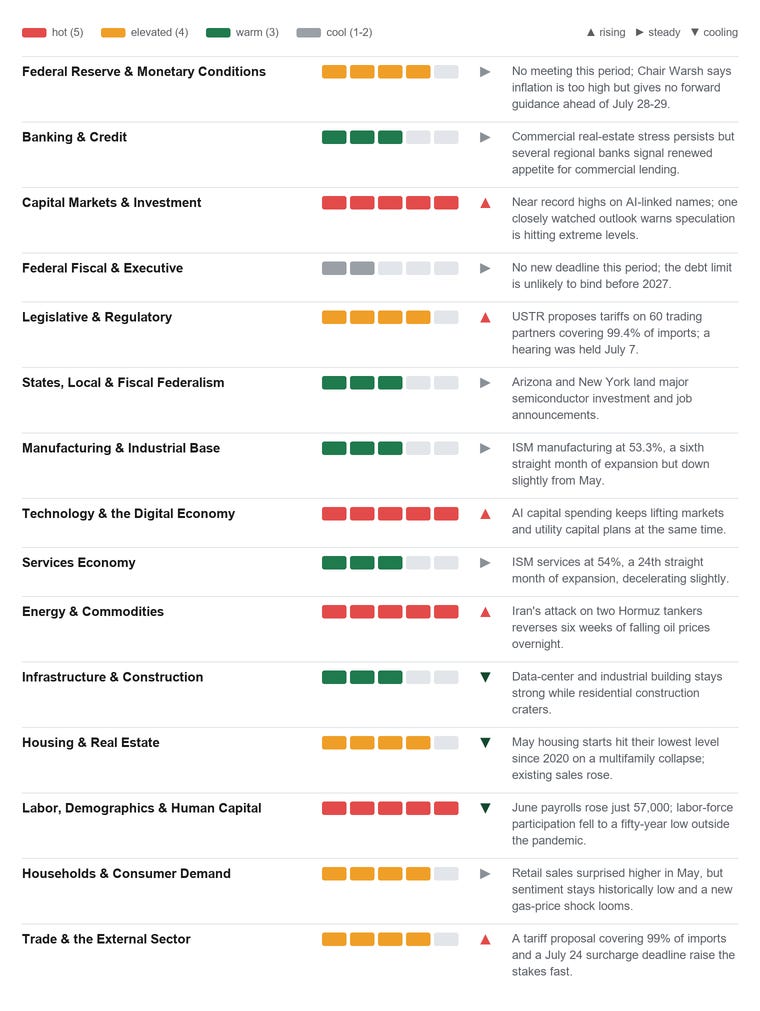
How to read this. Heat (1 to 5) shows how active a domain is this period, not its long-run importance. Arrows show direction versus the last edition. Every material claim links to a primary release or two independent, reputable sources; where the model is projecting rather than reporting, we say so directly.
The national read
Fifty-seven thousand. That is how many jobs the United States added in June, well under the 115,000 economists expected, and weaker than either of the two months before it once revisions are counted (Bureau of Labor Statistics, July 3, 2026). The unemployment rate still fell to 4.2%, but only because the share of adults working or looking for work dropped to 61.5%, the lowest reading outside the pandemic in fifty years, not because hiring picked up.
Then, the night before this edition closed, Iran’s Revolutionary Guard fired on two tankers in the Strait of Hormuz, and oil jumped as much as 5.6% after hours, undoing weeks of declines that had just started to ease household worry about gasoline prices (Reuters, reported via The Washington Post and Bloomberg, July 7, 2026).
Add a stock market sitting near record highs, built almost entirely on AI-linked names, and this period’s throughline comes into focus. Three separate channels, a softening job market, a reawakened energy shock, and a rally some strategists now call overextended, are all converging on the same household budget within days of each other, right before the Federal Reserve’s July 28 to 29 meeting. None of the three would force Chair Kevin Warsh’s hand alone. Together, they hand him a genuinely two-sided decision.
Deep dive: Labor. The unemployment rate fell to 4.2%, for the wrong reason
A participation story, not a hiring story
June payrolls rose by just 57,000, and the unemployment rate still dropped to 4.2%, but only because more than 200,000 people left the labor force, pulling participation down to 61.5%, the lowest reading outside the pandemic in fifty years (Bureau of Labor Statistics, July 3, 2026).
A falling unemployment rate usually tells the Federal Reserve that hiring is tight and wage pressure is building. This time the drop is a participation story: job openings and quits both sat still in May at 7.6 million and 3.1 million (Bureau of Labor Statistics, JOLTS, May 2026), and wage growth slowed to 3.4% over the year, the softest pace since August 2021. That reading feeds directly into the Federal Reserve’s July 28 to 29 meeting, the model’s labor-to-Federal-Reserve channel, one this map treats as carrying nearly its full force rather than fading with distance.
Immigration enforcement is one of the forces pulling people out of the workforce, since immigrant workers participate at higher rates than the native-born population (Federal Reserve Bank of Kansas City research; Indeed Hiring Lab, 2026). Leisure and hospitality alone shed 61,000 jobs in June, and workers who keep their jobs but whose pay no longer outruns inflation are the ones absorbing the squeeze.
The less obvious point: a shrinking labor force can make a soft economy look tight on paper, exactly the wrong signal for a new Federal Reserve chair calibrating his first independent rate path. Chair Warsh could read 4.2% as full employment when hiring, quits, and wage growth are all stalling underneath it, right as a fresh energy shock pulls the same meeting in the opposite direction.
Base case: participation keeps drifting down through the third quarter as enforcement continues and hiring stays tepid. A real possibility, call it one in three: participation rebounds as workers re-enter for seasonal hiring, which would push the unemployment rate up on paper even as the labor market genuinely improves, a result the Federal Reserve would have to explain as good news. Watch the July jobs report (Bureau of Labor Statistics, August 1) for whether participation stabilizes; a jump in layoffs above the current 1.1% rate would instead confirm real deterioration rather than a supply-side effect.
Deep dive: Energy. Iran hits two more tankers, and the reopening trade reverses in real time
The fastest channel in the model just fired again
On the night of July 6 into July 7, Iran’s Revolutionary Guard fired on two tankers transiting the Strait of Hormuz, a Qatari liquefied natural gas carrier that caught fire and a Saudi-flagged crude tanker, sending Brent crude up as much as 5.6% after hours to roughly $76 a barrel, just as oil had fallen back under $70 on the strength of a reopened strait (Reuters, reported via Bloomberg and The Washington Post, July 7, 2026); U.S. Energy Information Administration, Short-Term Energy Outlook, July 2026.
This runs the model’s fastest, least-softened paths at once: energy into household budgets and sentiment, and energy into headline inflation, both within weeks rather than quarters. The Energy Information Administration had just cut its third-quarter Brent forecast by $27 a barrel, to $74, on the assumption that reopened shipping lanes would keep supply flowing, an assumption this week’s attacks directly test.
Drivers and utility ratepayers feel it first; the University of Michigan’s consumer-sentiment index had just posted its first real improvement in four months, to 49.5, largely because gasoline had gotten cheaper (University of Michigan Surveys of Consumers, June 2026), a gain now at risk of reversing before most households even notice it happened. Energy producers and shippers gain from higher prices and war-risk premiums; businesses running on thin fuel margins, trucking and airlines among them, sit on the losing side.
The less obvious point: the same week oil spiked, the nation’s utilities were separately absorbing a wave of AI-driven capital spending to keep pace with data-center power demand, which the Energy Information Administration already expects to push residential electricity prices higher this year on top of a roughly 40% rise since 2021. Oil and electricity prices do not usually move together this cleanly, but this cycle both are headed the same direction for unrelated reasons, doubling up on the household energy-cost channel into inflation and sentiment at once.
Base case: this week’s attacks repeat the intermittent pattern seen since the war began in February, not a full re-closure, and prices settle back toward the mid-$70s once shippers and insurers reassess the risk. A less likely path, perhaps one in four: a sustained closure again cuts flows meaningfully, which could push Brent well above $100 and add a full percentage point or more to headline inflation, as the June edition of this Signal traced. Watch tanker traffic and war-risk insurance pricing over the next two weeks; a ceasefire mechanism holding through August would be the strongest sign this was a one-off.
Deep dive: Capital markets and technology. Record highs built on AI are starting to draw froth warnings
The same trade is now the stock market and the electric bill
The S&P 500 sits within about 1% of its all-time high, semiconductor stocks are up more than 80% for the first half of the year, Micron is up 242% year to date, and South Korea’s SK Hynix is preparing a $28 billion Nasdaq listing, even as one closely watched market outlook warns that speculation is hitting extreme levels (Fortune, July 5, 2026).
Market value is now concentrated in a small group of AI-linked names, so a swing in them moves the whole index, and the index moves household net worth through retirement accounts within the same quarter. This wealth channel is one the transmission map treats as carrying its full force while that concentration stays high. It also loops back into energy: the same AI buildout lifting these stocks is the reason utilities filed a sharply larger capital-spending plan this cycle to meet data-center power demand (see the energy deep dive above), so the market’s AI enthusiasm and the household electricity bill are now, in effect, the same trade.
Retirement savers and anyone holding equities benefit on paper as long as the rally holds. The risk concentrates in households and pension funds most exposed to a handful of AI-linked names, and in the utilities and chipmakers whose spending plans now assume the AI cycle keeps its current pace. Workers facing AI-driven displacement pressure do not receive the wealth-effect benefit at all; the gains and the risk are not landing on the same households.
The less obvious point: a market pullback would hit consumer spending through the wealth effect at the exact moment energy prices are spiking again and the labor market is cooling, three separate channels converging on the same household budget from different directions within the same period, a heavier combined hit than any one channel alone would suggest.
Base case: the rally keeps grinding higher through the summer on continued capital-spending guidance from the largest technology companies, with periodic swings. A real risk, perhaps one in four or five, in line with the extreme-speculation framing above: a valuation-driven correction, possibly triggered by a weak earnings print or a capital-spending guidance cut, tests the wealth-effect channel into consumer spending just as energy and labor headwinds build. Watch capital-spending guidance holding through earnings season in late July; a major guidance cut from any of the largest cloud and AI infrastructure companies would be the clearest break signal.
Chain of the period
One chain, traced start to finish through the transmission map.
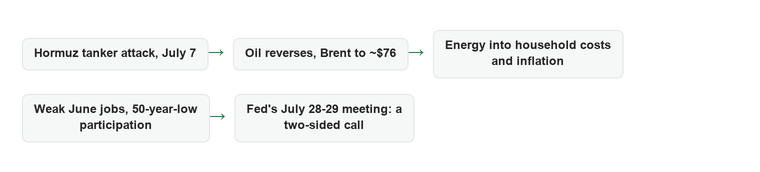
Start at the Strait of Hormuz. Iran’s attack on two tankers this week reverses a six-week decline that had pushed Brent crude under $70 a barrel on hopes the strait would stay open; Brent jumped as high as $76 after hours. From there, two of the model’s fastest, least-softened paths fire at once: energy into household budgets and sentiment, and energy into headline inflation. On its own, that would argue for a hawkish Federal Reserve. But it lands on top of a labor market that just posted its weakest jobs report in years and its lowest participation rate outside the pandemic in fifty years, a channel arguing the opposite direction through the Federal Reserve’s dual mandate. Two paths the model does not soften, pointing at the same meeting, in opposite directions. Chair Warsh’s July 28 to 29 decision inherits both.
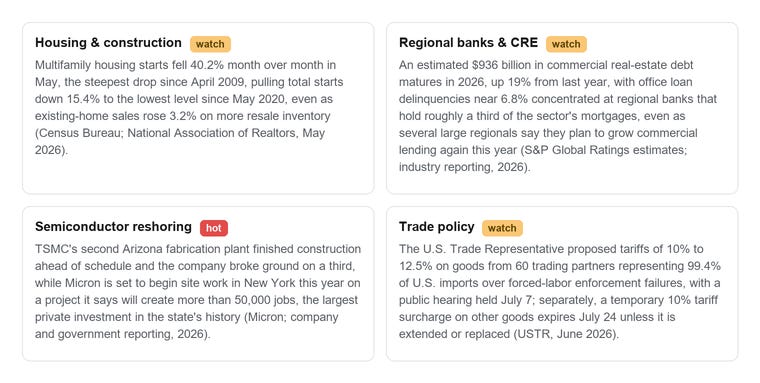
Sector & region movers
Subscribe to the US Economy Signal →
What to watch next
The Federal Reserve’s FOMC meeting, July 28 to 29: Chair Warsh’s second meeting, and whether the labor-versus-energy tension breaks toward a hold or a hike.
June’s Consumer Price Index report (Bureau of Labor Statistics, mid-July): the first full monthly read on prices since this week’s tanker attacks.
June retail sales (Census Bureau, mid-July): whether May’s 0.9% surge holds now that gasoline prices are climbing again.
June existing-home sales (National Association of Realtors, July 9) and June housing starts (Census Bureau, mid-July): whether May’s construction collapse was a one-month air pocket or the start of a trend.
The Section 122 tariff surcharge expiration, July 24: whether Congress extends it or lets the new Section 301 forced-labor tariffs take its place.
July’s jobs report (Bureau of Labor Statistics, August 1): whether labor-force participation keeps falling or stabilizes.
The heat map: all fifteen domains
Sources
[23] Micron Technology, “New York Expansion,” 2026. micron.com (accessed 7 Jul 2026).
Every material claim in this edition is verified to one primary (Tier-1) source or two independent, reputable (Tier-2) sources. Items resting on a single secondary source are flagged in-text or in the citation above.
***